How do local police measure up?
By Isaac Peterson
Contributing Writer
Racial tensions in the U.S. have reached the boiling point in the wake of the deaths of two Black males at the hands of police officers and the announcements in the last few days that grand juries declined to bring charges against either officer.
Eighteen-year-old Michael Brown was shot and killed by Ferguson, Missouri police officer Darren Wilson just weeks after Eric Garner was placed in a chokehold that resulted in his death by Daniel Pantaleo in New York. Both officers are White.

to downtown Minneapolis.
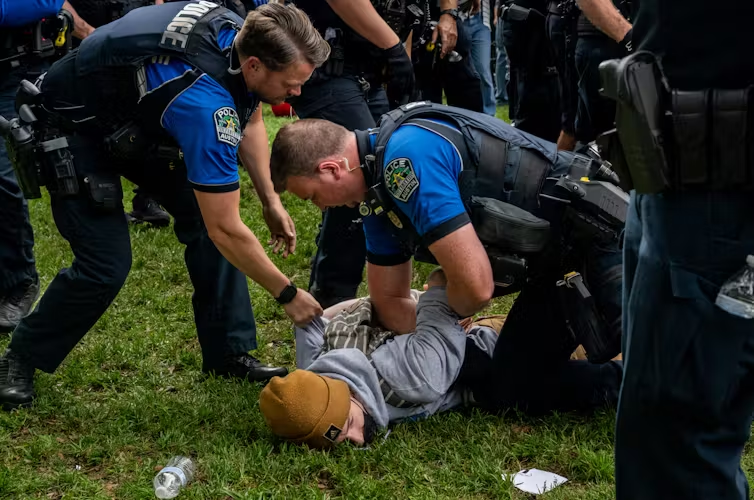
The racial tension, already high, reached the flashpoint nationwide in the last few days following the grand jury announcements. Protests, some becoming violent, took place all over the country, including the Twin Cities, decrying a system that seems to allow police to murder Black males with impunity and with no repercussions.
Nationally, according to a ProPublica study done last October, Black males are 21 times more likely to be shot and killed by police than their White counterparts. So the Twin Cities Daily Planet attempted to look into the Twin Cities’ police shooting records to see if the cities’ numbers reflect a similar trend. St. Paul provided their numbers between 2008 and 2014, but Minneapolis spokesman John Elder told the Daily Planet to file a formal data request, a process that can take several months.
Between 2008 and 2014, there were eight fatal shootings by police officers in St. Paul. Of those shootings, five were African American and two were White, making Black males almost twice more likely to be fatally shot by police than their White counterparts.
To put these numbers into context, according to 2010 census data, African Americans make up about 16 percent of St. Paul’s population, while Whites make up 60 percent. While those numbers don’t reflect an even playing field in St. Paul, they’re still far lower than the “21 times more likely” national statistic.
St. Paul Police spokesman Sgt. Paul Paulos attributes that to two major factors: hiring police officers from the neighborhoods where they will be serving, and the training they receive. “We started being a department that is responsive to, and reflective of, the community that we serve,” Paulos said. “[St. Paul police officers] have a better understanding of the community, and that way they can be reflective of it.”
Concerning training, Paulos indicated that his department puts officers through diversity training, as well as how to recognize and deal with mental illness in communities. “We do cultural things within the department that help us strengthen those relationships; we also do tremendous community outreach, whether it’s the African American community, the Somali, the Hmong, Hispanics, and our newest population here in St. Paul, the Karen [Burmese].”
Understanding the affected cultures, Paulos said, leads to more positive outcomes between the police and the community.
Below are St. Paul’s full record of fatal shootings between 2008 and 2014.
• In 2008 and 2011, no fatal shootings
• 2009 — two fatal shootings, a 35-year-old White male, a 19-year-old Black male
• 2010 — two shootings, a 21-year-old Black male, a 36-year-old White male
• 2012 — three shootings, a 50-year-old Black male, a 22-year-old Asian male, a 20-year-old Black male
• 2013 — one shooting, a 32-year-old Black male
ProPublica’s study looked at more than 12,000 fatal police shootings from 1980 to 2012. They examined data voluntarily reported by hundreds of police departments to the FBI each year, in what is called the Supplementary Homicide Report.
The years 2010 to 2012 were the most recent years for which FBI figures were available. In that time, according to the data 1,217 deadly police shootings were reported, and Black males from age 15-19 were killed by police roughly 21 times more often than their White counterparts, or at a rate of 31.17 per million per Black for youths, compared to 1.47 per million for White males.
Other key findings from the study include:
• 40 teens 14 years or younger were reported killed by police from 1980 to 2012: 27 Black, eight White, four Hispanic, and one Asian.
• 44 percent of all those killed by police in those years were White. The average age of Blacks killed was 30, while the average age of Whites was 35.
• Black police officers accounted for about 10 percent of fatal shootings, and 78 percent of those killed by them were Black.
• White officers killed 91 percent of the Whites who died at the hands of police, and 68 percent of non-Whites.
• From 1980 to 1984, “officer under attack” was listed as the cause for 33 percent of the fatal shootings. From 2005 to 2009, “officer under attack” was cited in 62 percent of police killings.
Most police killings involve officers firing handguns, but from 1980 to 2012, 714 incidents involved officers using shotguns. “The Los Angeles Police Department has a special claim on that category,” according to the study. “It accounted for 47 cases in which an officer used a shotgun. The next highest total came from the Dallas Police Department: 14.”
While being careful to note that not every police department reports annually, ProPublica quoted David Klinger, a University of Missouri-St. Louis professor and expert on police use of deadly force as noting that “… racial disparities in the data could result from ‘measurement error,’ meaning that the unreported killings could alter ProPublica’s findings.” But he added that the racial disparity is so wide that “I doubt the measurement error would account for that.”
Isaac Peterson welcomes reader responses to ipeterson@spokesman-recorder.com.
Thanks to the TC Daily Planet for sharing this story with us.
Support Black local news
Help amplify Black voices by donating to the MSR. Your contribution enables critical coverage of issues affecting the community and empowers authentic storytelling.